

Correlating a vehicle model properly is slow. It takes days, sometimes a week of manual work, so most teams do it once, early in a program, and then keep simulating on a model that no longer reflects the car.
It does not have to cost that much time. We call the approach agentic correlation: an AI agent runs the whole campaign end to end, comparing simulation against test data, calibrating each parameter, and documenting every step, while the engineer supervises. This is a walkthrough of a real run of it, on Canopy Simulations.
About Canopy Simulations
We ran this on Canopy Simulations. Its advanced dynamic lap simulation platform can launch hundreds of simulations in parallel and return the results within five minutes. Canopy's default car models provide a starting point without requiring specialist knowledge of your vehicle characteristics. The simulation can be extensively configured to capture a wide range of real-world effects, from straightforward grip correlation to detailed vehicle kinematics and localised weather effects.
Canopy's API enables an agent to talk directly to the simulation engine, submitting jobs, retrieving results, and updating configs without any human interaction. The platform keeps every result organized, tracked, and accessible for later review instead of scattered across an engineer's machine. It makes for the perfect environment for an AI agent to work in.
The project
We are developing a sports or track car. The job: take the vehicle model and logged test data, and produce a model an engineer would trust to make decisions on. Everything downstream of a model inherits its credibility from it: setup exploration, optimization, and target chasing are only as good as the model underneath, so correlation is where the work starts.
The correlation and validation shown below were run by multiple AI agents inside the MOVEdot platform, communicating with each other and documenting the process as they went. The agents have learned the workflow, so they now run the entire process in hours. The same work done manually by an engineer takes days.
Here is what that looks like from the inside.
Start simple
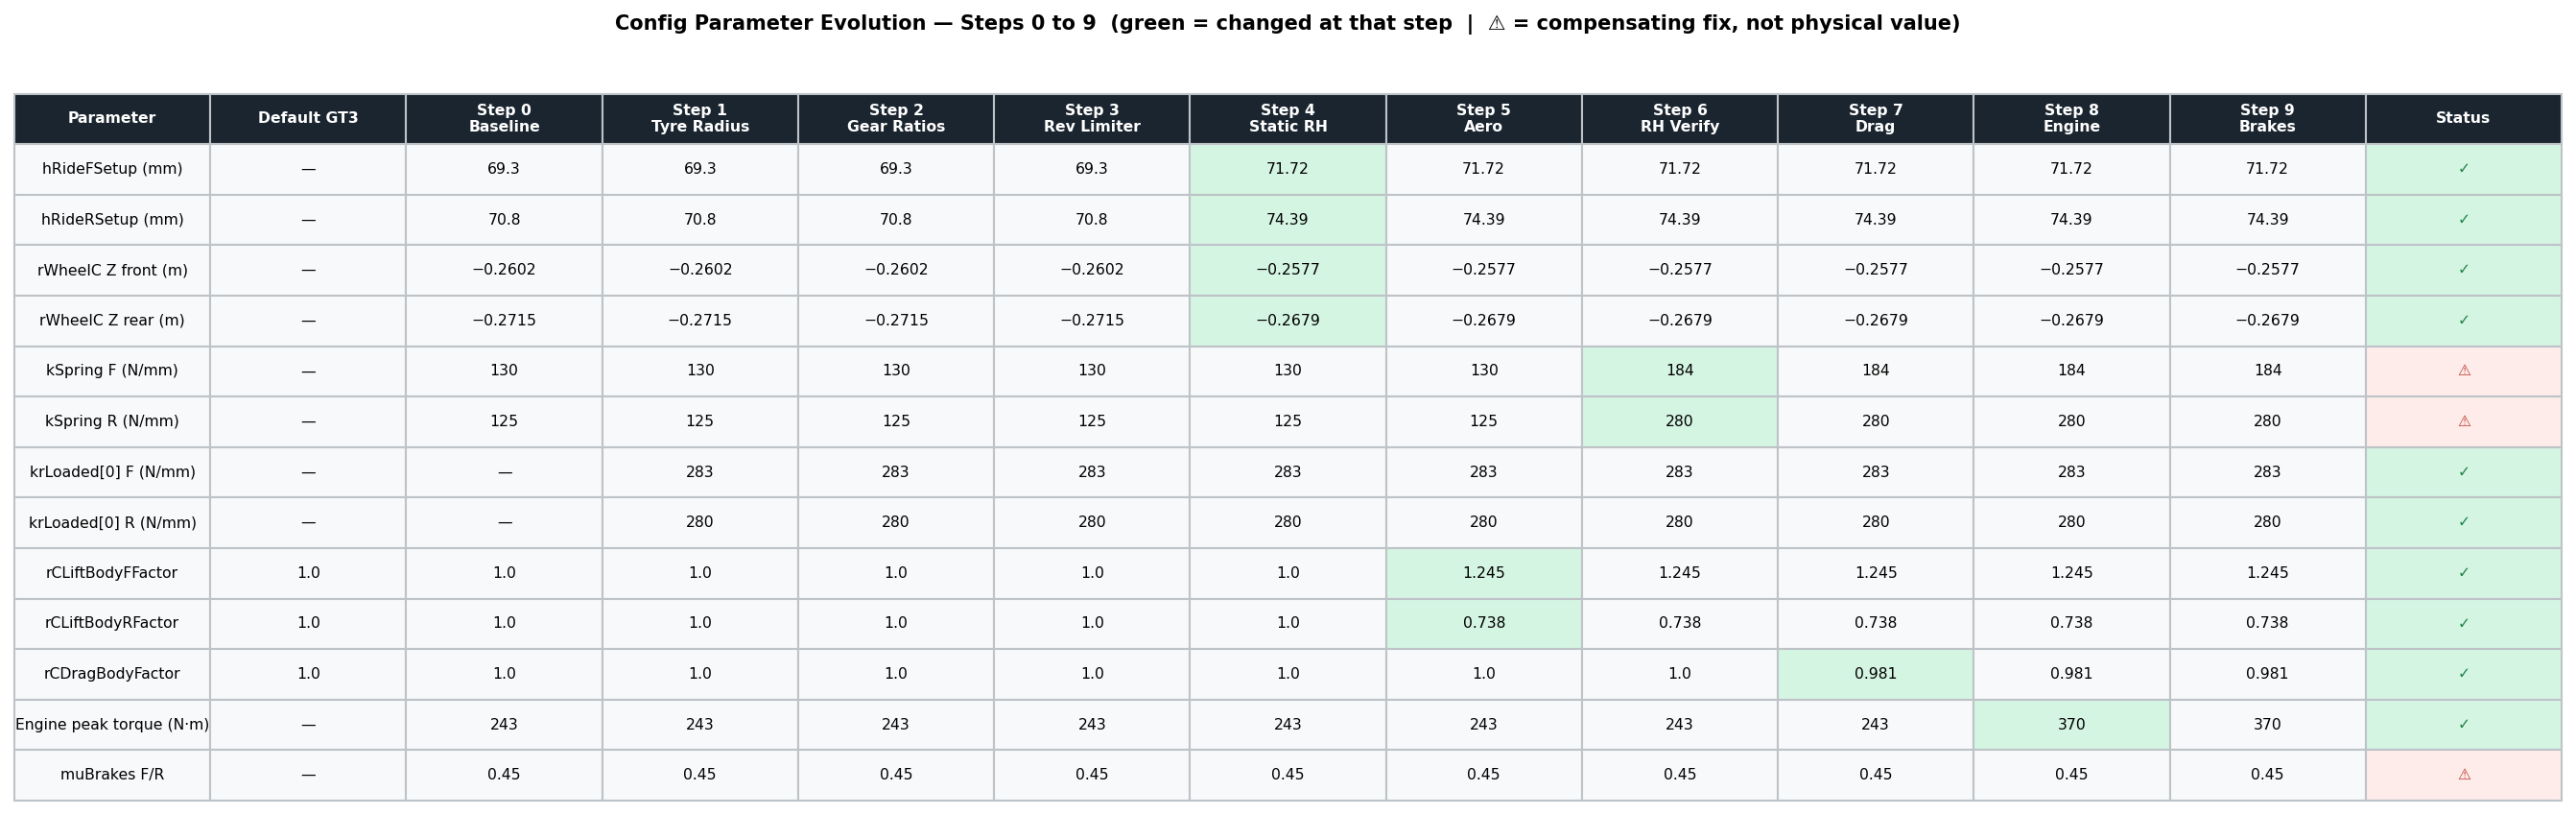
The method is the one a careful engineer already knows: isolate one effect at a time, confirm it against data, and only then move to the next. A full lap mixes every effect at once, so a disagreement there could come from anywhere; isolating the effects first gives each disagreement one place to live. Specific parameters are extracted from the specific maneuvers where they dominate, in the order shown below.
The work begins in a straight line, where the fewest effects act at once, and correlates the longitudinal fundamentals: powertrain, aero drag, downforce and ride heights, suspension stiffness, and braking.
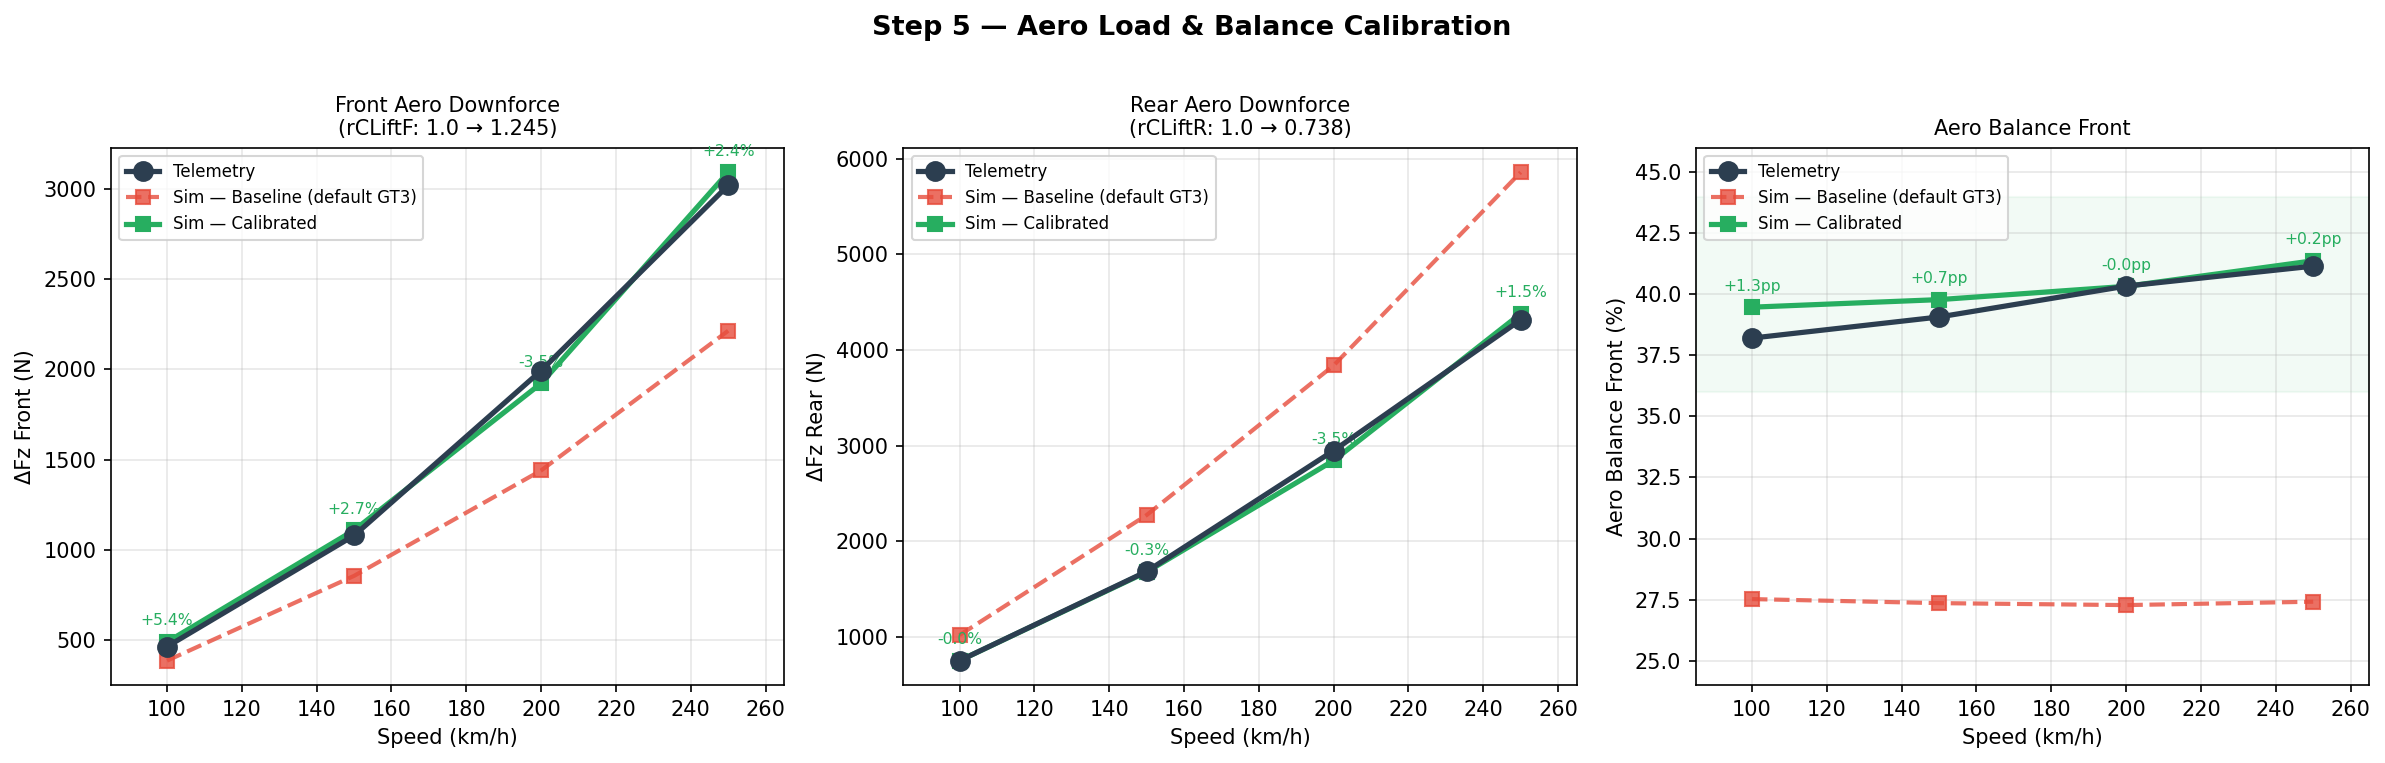
Take ride height. With the setup-sheet spring rates, the model sat almost 8 mm off the car at 200 km/h at the rear, enough to put the whole aero platform in the wrong place. Correlating the ride-height-versus-speed slope against test data, the agent found the spring rate adjustments, from stiffness or kinematics uncertainties, that closed the gap, cutting rear ride-height error by roughly 60 percent and front by 70 percent, both into single-digit-millimetre agreement across the speed range. The work also surfaced a real characteristic of the car: it runs around 40 percent front aero balance, against the 27 percent of the default model it started from. Because each parameter was confirmed on its own, the agreement is not a lucky cancellation of separate errors: every value is right for a reason you can point to.
Then build up
With the longitudinal platform fixed, the remaining unknowns are lateral: grip, aero balance, roll, steering response. They get the same treatment in CorneringSim, one at a time, on top of what is already correlated.
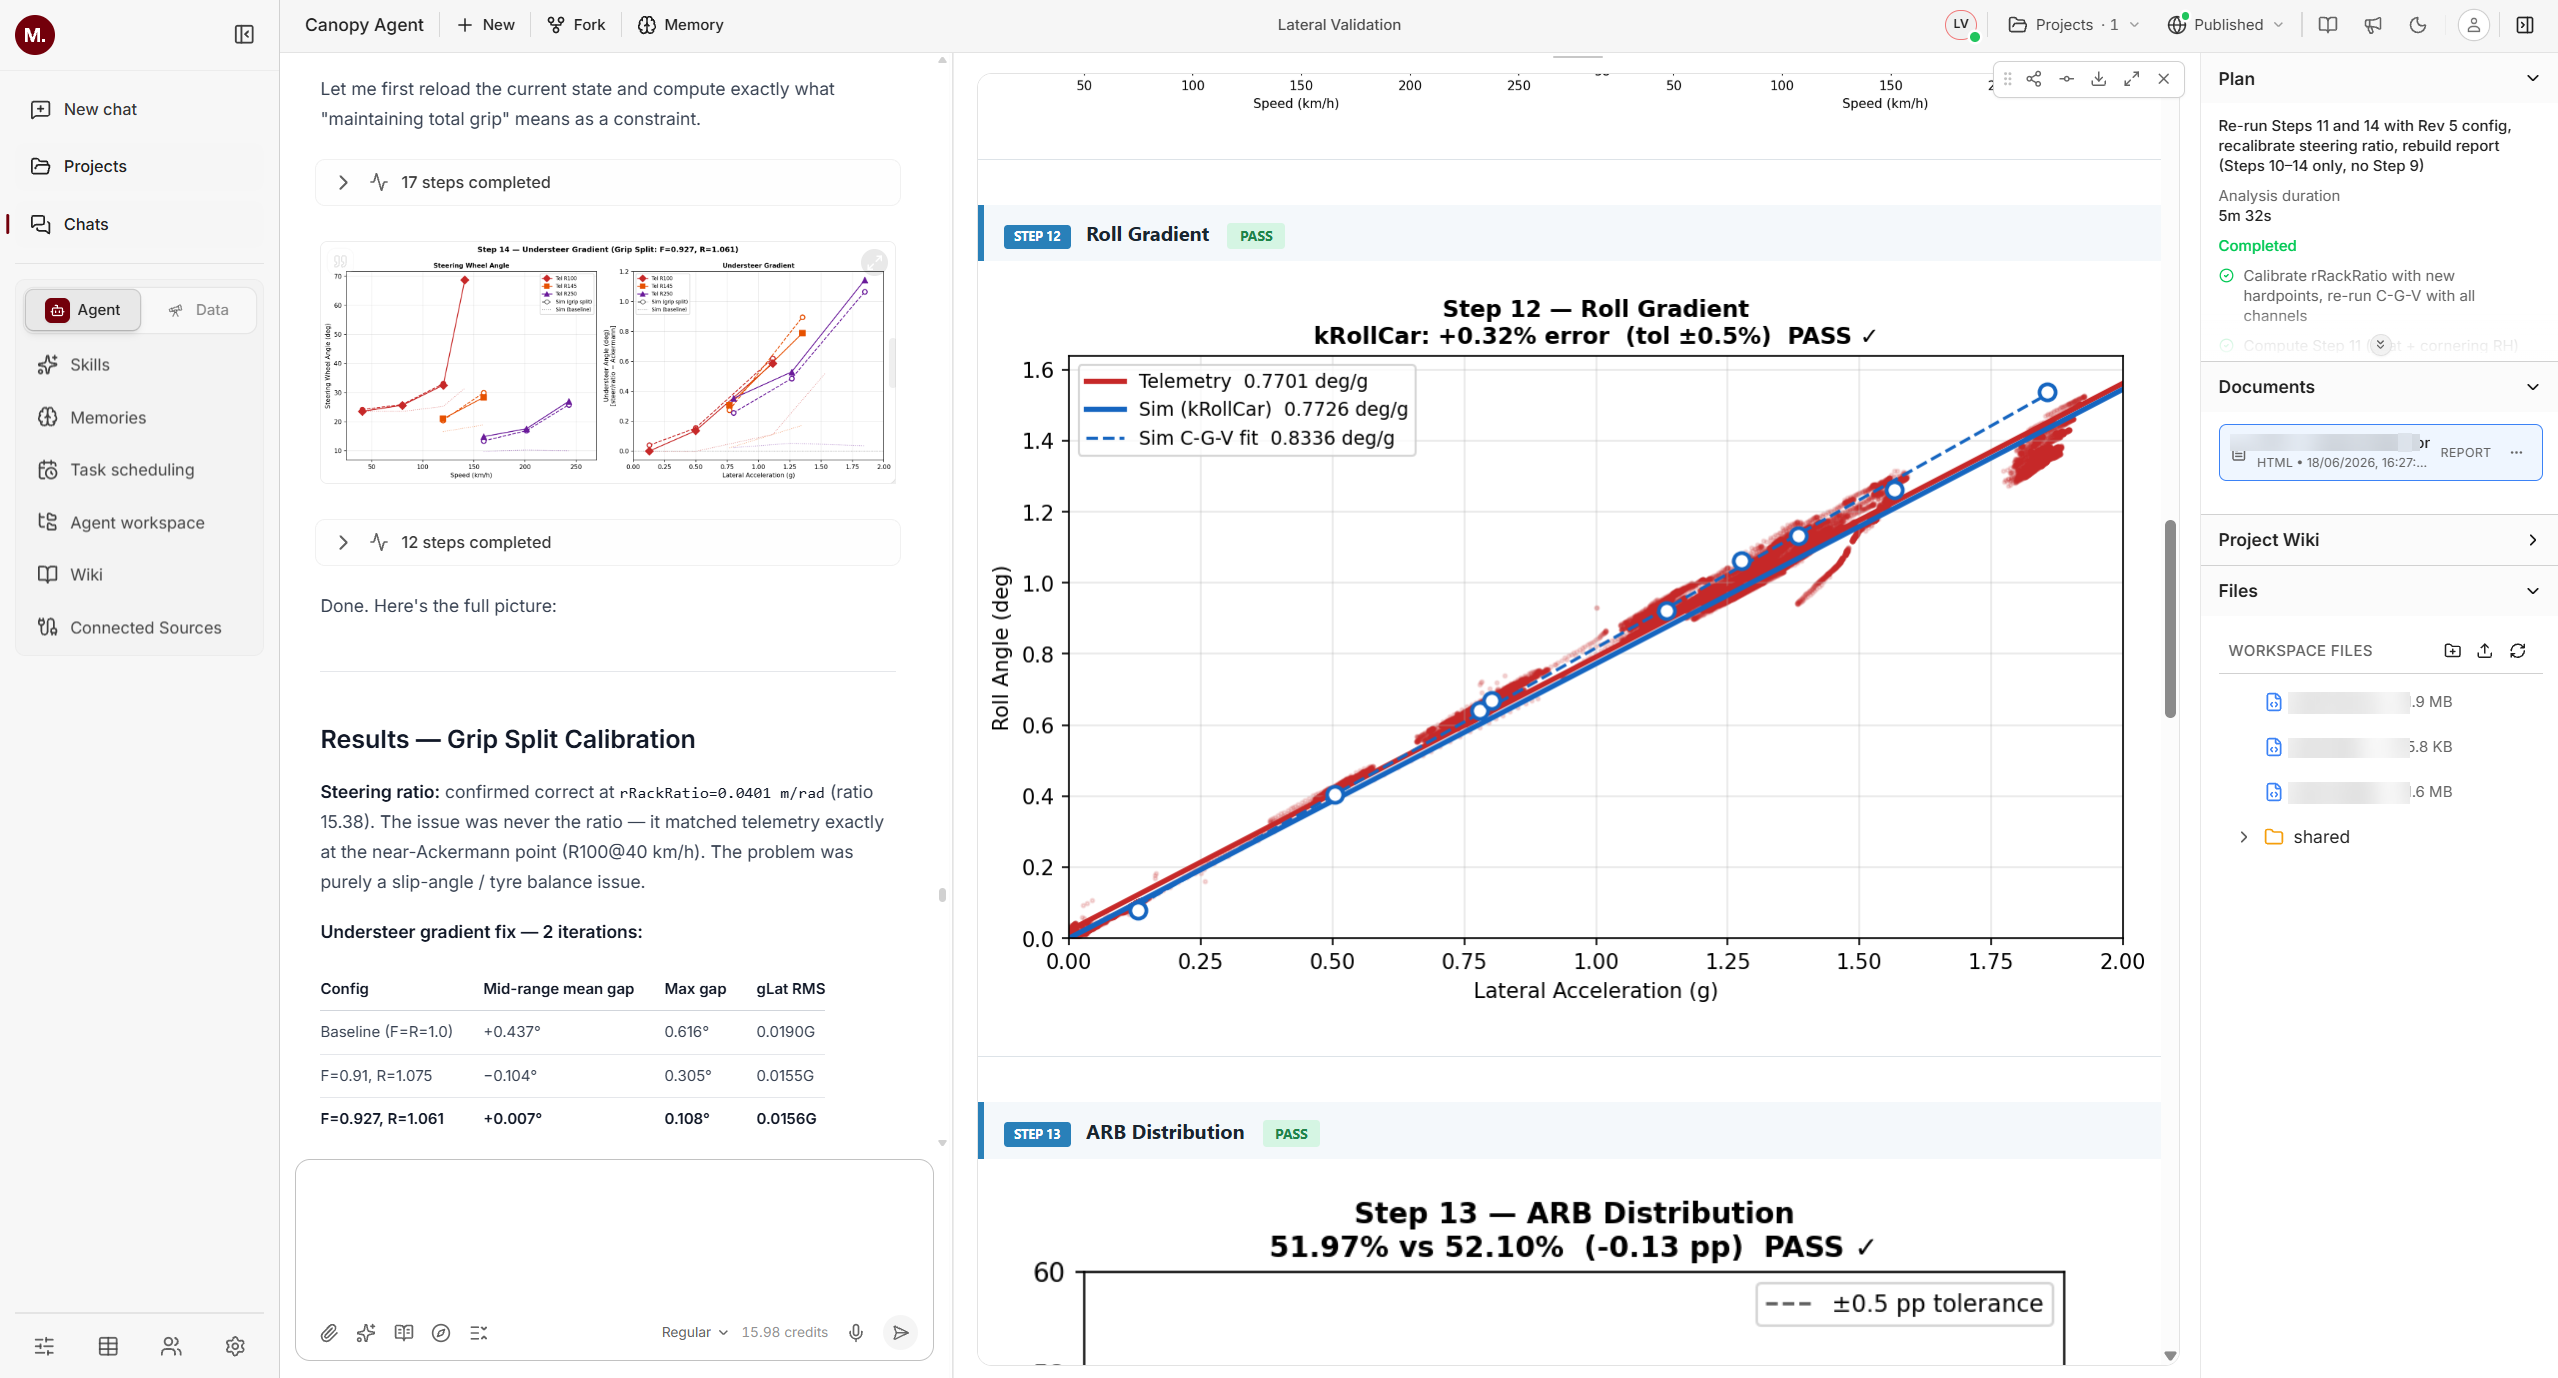
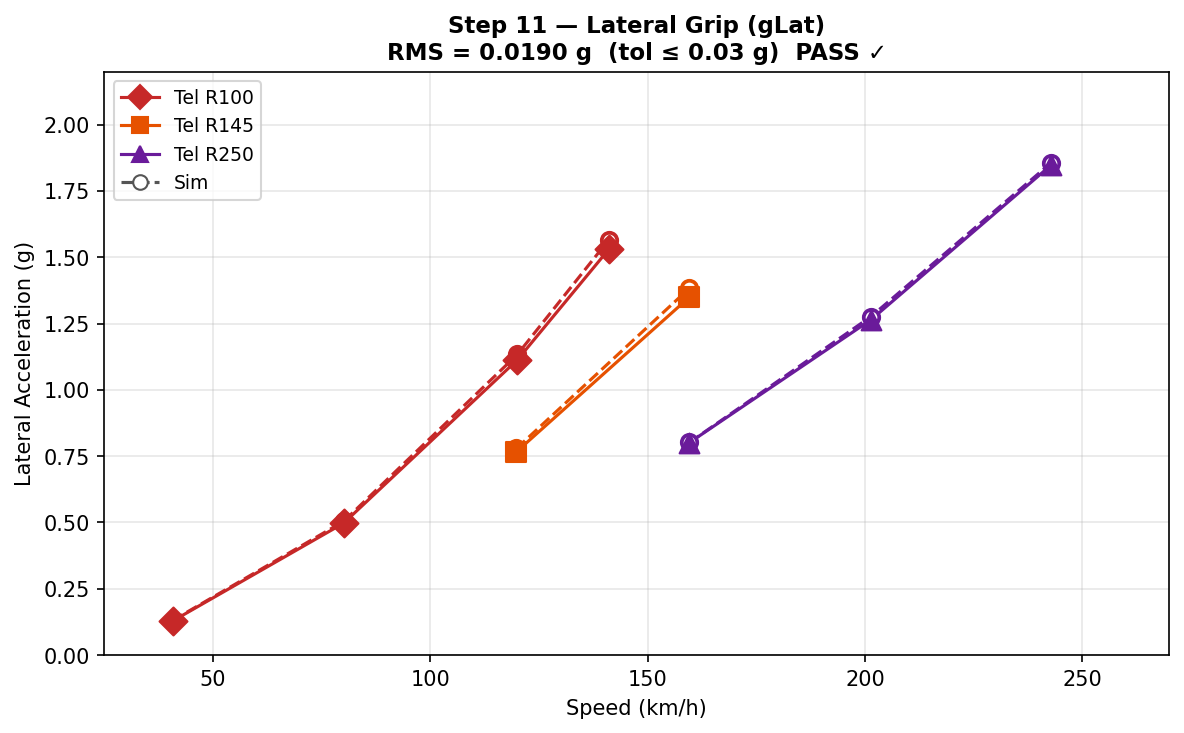
The skidpad sweep shows how the phases build on each other. Lateral grip at low speed is almost purely mechanical; at high speed it is dominated by aero load, which the straight-line phase already pinned down. Plotting lateral acceleration against speed separates the two contributions on a single chart, and points to exactly which part of the model owns any remaining disagreement. By the end of the phase the lateral grip matched the test data to 0.0156 g RMS, the roll gradient to within a third of a percent, and the understeer gradient to a mean of seven thousandths of a degree across the operating range.
The full lap
Only once every effect is correlated in isolation does the full lap come into play. This is the test that everything fits together: a full dynamic lap simulation running on the correlated parameters, now acting all at once, against a real lap of test data. Because each one was already correlated on its own, the lap is where they are confirmed as a whole rather than where they are tuned.
The plot below puts three traces side by side on every channel: the test data, the default model the campaign started from, and the correlated model. The gap between the default and the data is what correlation closes. On the straights, the default model runs short on power and tops out below the real car; the correlated model reaches the same speed. Into the braking zones, the default brakes earlier and softer, while the correlated model matches the real brake application and the deceleration that follows. Through the corners, the lateral acceleration that the default leaves on the table is back, because the grip and balance were fixed upstream.
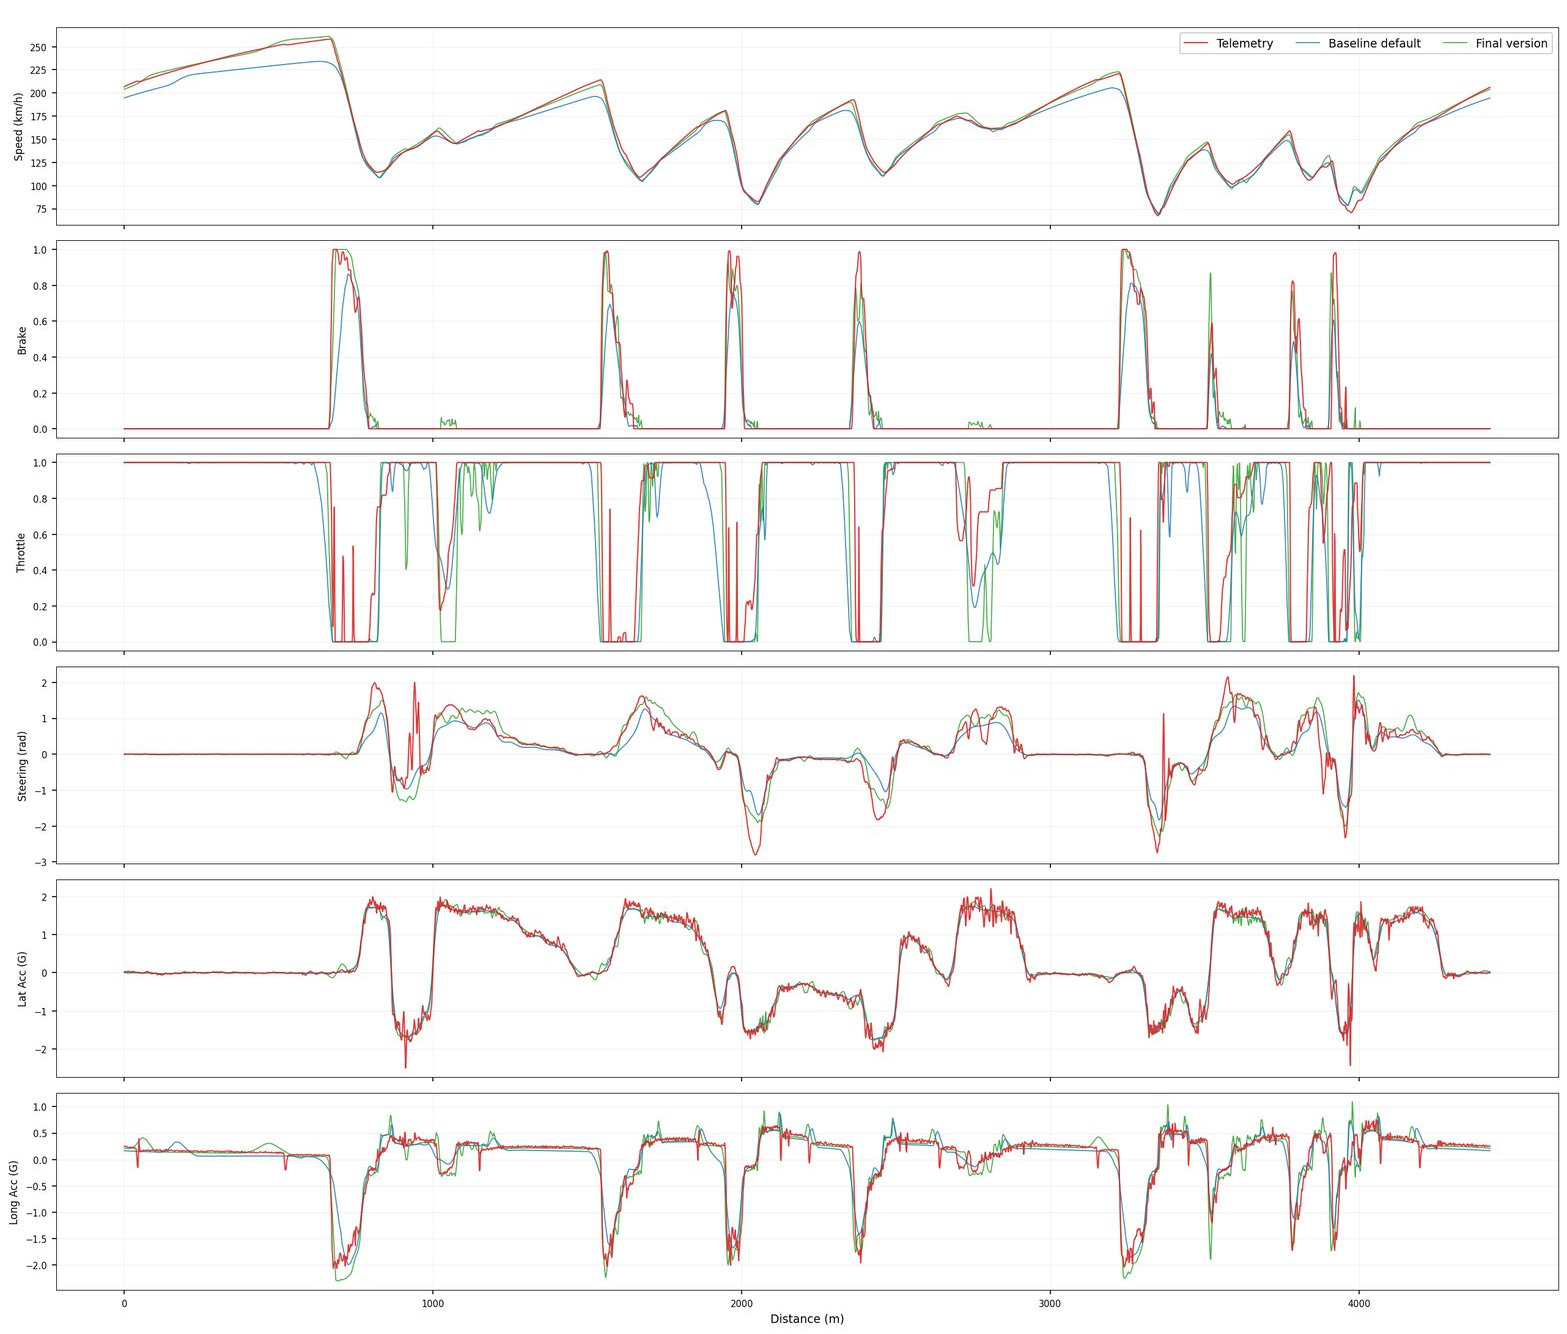
That is the point of leaving the lap until last. Lap time matters, and it is the number everyone asks about, but a lap time delta alone proves little: you never hit exactly zero, the delta absorbs the driver as much as the car, and a matching time can hide errors cancelling underneath. The check that counts is the one the lap makes visible channel by channel, each tracking the data for its own reason.
Documented as it runs
The campaign does not run as one opaque session. It runs as a project: separate chats for separate phases, all sharing context. The cornering work knows what the straight-line work changed. The full-lap check knows the history of every parameter. When a later phase touches something that earlier results depended on, an aero balance adjustment for example, the project knows which earlier checks that affects, and re-verifies them.
Every parameter that moved is tied to the maneuver and the data that justified moving it. And all of it accumulates into a wiki as the work happens: which comparisons ran, what changed, why, and by how much. The correlation report is not something an engineer writes afterwards. It is built while the work happens.
This is the difference between a model that matches and a model you trust. Matching is a plot. Trust is being able to open the record and read the reason behind every change. Six months from now, when someone asks why a parameter is what it is, the answer is on file.
Why this works: MOVEdot and Canopy together
Everything above is methodology, not magic. It is a specific engineering process with two properties that make it a natural fit for an agent: it is repetitive, dozens of small well-defined comparisons each ending in a run, a check, and a decision; and it is patient work that engineers rarely have time to do as often as they should.
Doing it well takes both halves. On the MOVEdot side: capable agents that run the workflow end to end, several of them coordinating and handing context to each other, learning a process once and repeating it reliably, all inside the governance and security a team needs to run agents on its own data. On the Canopy side: the cloud capacity to launch hundreds of simulations at once, the speed to return them in minutes, the channels to compare against the data signal for signal, and the organization that keeps every result tracked and reviewable. MOVEdot supplies the agents; Canopy gives them an environment fast and open enough to work in. Your engineers stay in the loop, set the targets, and make the calls that matter. The part that used to cost a week now takes hours.
Correlation as a habit
Done by hand, this campaign is a week of an engineer's time, which is exactly why it happens once a season instead of after every test day. Here it ran in hours, with the simulations going to the cloud in parallel.
And it is a loop, not a one-off. New test data comes in, the same sequence reruns, and the model is brought back into line before small differences become large ones. Correlation stops being an event and becomes a habit: same methodology, same discipline, at a scale no person has time for.
Nothing here is specific to this car. The same campaign runs on your model and your data: a different vehicle class, a different set of maneuvers.
If you already have a Canopy subscription and test data, this is close to plug and play: it connects to the environment you already work in, your configs, your data, your cloud. We are happy to walk you through the workflow and the engineering behind it, and to set it up together.
Get in touch: info@movedot.com, or www.movedot.ai.